
- Nuclear Essentials
- Information Library
- Our Association
- Press
- Events
- Gallery
- Shop
- Nuclear energy and climate change
- Ukraine and nuclear energy
- Member Login
- Information Library A-Z
Home / Information Library / Nuclear Fuel Cycle / Mining of Uranium / World Uranium Mining Production
World Uranium Mining Production
(Updated May 2023)
- About two-thirds of the world’s production of uranium from mines is from Kazakhstan, Canada and Australia.
- An increasing amount of uranium, now over 55%, is produced by in situ leaching.
In 2022 Kazakhstan produced the largest share of uranium from mines (43% of world supply), followed by Canada (15%) and Namibia (11%).
Charts can be viewed by clicking on the above link.
* Data from the World Nuclear Association. NB: the figures in this table are liable to change as new data becomes available. Totals may not sum exactly due to rounding.
Mining methods have been changing. In 1990, 55% of world production came from underground mines, but this shrunk dramatically to 1999, with 33% then. From 2000 the new Canadian mines increased it again. In 2022 in situ leach (ISL, also called in situ recovery, ISR) mining accounted for over 55% of production:Methodtonnes U%In situ leach (ISL)27,30756%Underground & open pit (except Olympic Dam)18,56938%By-product30136%
Conventional mines have a mill where the ore is crushed, ground and then leached with sulfuric acid to dissolve the uranium oxides. At the mill of a conventional mine, or the treatment plant of an ISL operation, the uranium then separated by ion exchange before being dried and packed, usually as U3O8. Some mills and ISL operations (especially in the USA) use carbonate leaching instead of sulfuric acid, depending on the orebody. Where uranium is recovered as a by-product, e.g. of copper or phosphate, the treatment process is likely to be more complex.
During the 1990s the uranium production industry was consolidated by takeovers, mergers and closures, but this has diversified again with Kazakhstan’s multinational ownership structure. Over half of uranium mine production is from state-owned mining companies, some of which prioritise secure supply over market considerations. In 2021, the top 10 companies by production contributed about 90% of the world’s uranium production:
See charts by clicking on above link.
Note 1: SMCC, a joint venture between Kazatomprom and Uranium One, reported combined production of 2321 tU in 2021 at its two mines, South Inkai 4 and Akdala.
Note 2: KATCO, a joint venture between Kazatomprom and Orano, reported combined production of 2840 tU in 2021 across its two mines, Moinkum and Tortkuduk.
World uranium production and reactor requirements (tonnes U)
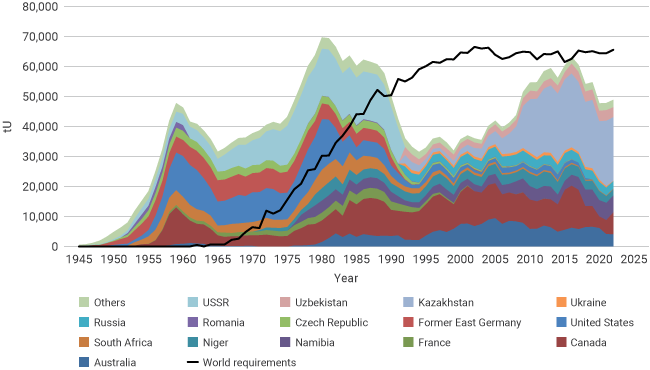
Sources: OECD-NEA/IAEA, World Nuclear Association
Uranium resources by country in 2021
See charts by clicking on above link.
Identified resources recoverable (reasonably assured resources plus inferred resources), to $130/kg U, 1/1/21, from OECD NEA & IAEA, Uranium 2022: Resources, Production and Demand (‘Red Book’). The total recoverable identified resources to $260/kg U is 7.918 million tonnes U.
Notes & references
Share
Related information
Australia
Canada: Uranium
Namibia
Niger
Uranium in Africa
World Uranium Mining Production
You may also be interested in


Got it
Privacy Notice ¦ Cookies Policy ¦ Reuse of World Nuclear Association Content
© 2016-2023 World Nuclear Association, registered in England and Wales, number 01215741.
Registered office: Tower House, 10 Southampton Street, London, WC2E 7HA, United Kingdom
