
Since Joseph Black discovered carbon dioxide and chemists began to understand its importance, we have harnessed it for many advantageous applications which assist humans in their endeavours.
The medical world has grown thanks to our understanding of how living things depend on carbon dioxide.
Breathing controlled by levels of carbon dioxide:
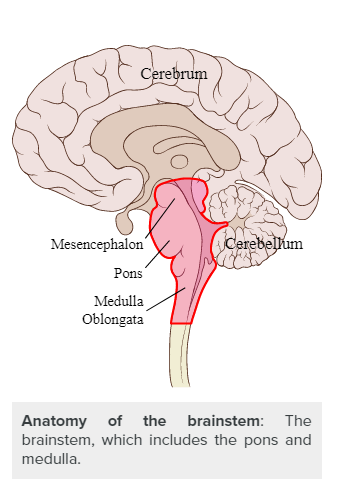
The level of carbon dioxide (CO2) in our body is what controls our breathing. When carbon dioxide reaches a certain level, a signal is sent from the Medulla ( breathing centre in our brain stem) to the breathing muscles, which triggers an inhalation.
Upon exhalation, we exhale carbon dioxide and a new breathing cycle starts. Carbon dioxide is produced in the body all the time, and when we breathe, we exhale the CO2 that has been built up in our body. The more active we are, the more CO2 is produced.
This model applies to all animal life.
Everything we eat can be traced back to photosynthesis, the process by which plants take up carbon dioxide from the air and use it to produce the vast array of organic compounds needed for life.
During cellular respiration animal cells combine oxygen with food molecules to release energy to live and function………cellular respiration produces carbon dioxide as a waste product. Animals use energy to grow, reproduce, and to function. They release the carbon dioxide into the air as a waste product. When animals die, their bodies decompose with the help of bacteria. Decomposition releases carbon dioxide into the atmosphere or water.
Fossilised plants and animals have formed ancient layers beneath the surface of the earth which humans discovered and mined as coal, then oil, then gas, thus releasing carbon dioxide when brought in to use in the Industrialised Era. This activity has upset the balance of the carbon cycle required for life on this planet. Greenhouse Gases have protected the earth’s temperature. Without these gases Earth would be 30 degrees cooler. But human activities have pushed the temperatures up. For an understanding of Climate Change read the Met Office UK page here.
Main Greenhouse Gases
This 2014 article below explains ( https://www.c2es.org/content/main-greenhouse-gases/)
Multiple gases contribute to the greenhouse effect that sets Earth’s temperature over geologic time. Small changes in the atmospheric concentration of these gases can lead to changes in temperature that make the difference between ice ages when mastodons roamed the Earth, and the sweltering heat in which the dinosaurs lived.
Two characteristics of atmospheric gases determine the strength of their greenhouse effect.
The first is their ability to absorb energy and radiate it (their “radiative efficiency”). The second is the atmospheric lifetime, which measures how long the gas stays in the atmosphere before natural processes (e.g., chemical reactions) remove it.
These characteristics are incorporated in the Global Warming Potential (GWP), a measure of the radiative effect (i.e. the strength of their greenhouse effect) of each unit of gas (by weight) over a specified period of time, expressed relative to the radiative effect of carbon dioxide (CO2). This is often calculated over 100 years, though it can be done for any time period. Gases with high GWPs will warm the Earth more than an equal amount of CO2 over the same time period. A gas with a long lifetime, but relatively low radiative efficiency, may end up exerting more warming influence than a gas that leaves the atmosphere faster than the time window of interest but has a comparatively high radiative efficiency, and this would be reflected in a higher GWP.
The table below presents atmospheric lifetime and GWP values for major greenhouse gases from the Fifth IPCC Assessment Report (AR5) released in 2014. These values are periodically updated by the scientific community as new research refines estimates of radiative properties and atmospheric removal mechanisms (sinks) for each gas.
Despite carbon dioxide’s comparatively low GWP among major greenhouse gases, the large human-caused increase in its atmospheric concentration has caused the majority of global warming. Likewise, methane is responsible for a large portion of recent warming despite having a GWP much lower than several other greenhouse gases because emissions have increased drastically.
| Greenhouse gas | Chemical formula | Global Warming Potential, 100-year time horizon | Atmospheric Lifetime (years) |
|---|---|---|---|
| Carbon Dioxide | CO2 | 1 | 100* |
| Methane | CH4 | 25 | 12 |
| Nitrous Oxide | N2O | 265 | 121 |
| Chlorofluorocarbon-12 (CFC-12) | CCl2F2 | 10,200 | 100 |
| Hydrofluorocarbon-23 (HFC-23) | CHF3 | 12,400 | 222 |
| Sulfur Hexafluoride | SF6 | 23,500 | 3,200 |
| Nitrogen Trifluoride | NF3 | 16,100 | 500 |
| SOURCEFifth Assessment Report (Intergovernmental Panel on Climate Change, 2014). |
* No single lifetime can be given for carbon dioxide because it moves throughout the earth system at differing rates. Some carbon dioxide will be absorbed very quickly, while some will remain in the atmosphere for thousands of years.
The table below shows the relative concentrations of these major greenhouse gases and their sources. Some gases (like CO2) are made by both natural and manmade processes, while others (like hydrofluorocarbons) are only the result of human industrial activity. CO2 is typically measured in parts per million because it is 1,000 times more prevalent than the other gases, but is shown as parts per billion in the table for consistency.
| Greenhouse gas | Major sources | Pre-industrial concentration (ppb) | 2011 concentration (ppb) |
|---|---|---|---|
| Carbon Dioxide | Fossil fuel combustion; Deforestation; Cement production | 278,000 | 390,000 |
| Methane | Fossil fuel production; Agriculture; Landfills | 722 | 1,803 |
| Nitrous Oxide | Fertilizer application; Fossil fuel and biomass combustion; Industrial processes | 271 | 324 |
| Chlorofluorocarbon-12 (CFC-12) | Refrigerants | 0 | 0.527 |
| Hydrofluorocarbon-23 (HFC-23) | Refrigerants | 0 | 0.024 |
| Sulfur Hexafluoride | Electricity transmission | 0 | 0.0073 |
| Nitrogen Trifluoride | Semiconductor manufacturing | 0 | 0.00086 |
| NOTESAtmospheric concentrations are all shown in parts per billion (ppb).SOURCEFifth Assessment Report (Intergovernmental Panel on Climate Change IPCC, 2014) |

You must be logged in to post a comment.